Benchmark LLM Performance on Turing and Ampere Nvidia GPUs
I wanted to see how various Nvidia GPUs of the Turing and Ampere generations compare in terms of LLM performance. I developed the tool stefanthoss/ollama-server-benchmark for benchmarking Ollama prompts. There are generally very few hard numbers available online so I’m listing details for 5 GPUs that I’m currently experimenting with.
GPU Selection
I’m comparing the following Nvidia GPUs:
| Model | Generation | CUDA Cores | Memory | Memory Bandwidth | TDP | PCIe Interface |
|---|---|---|---|---|---|---|
| Tesla T4 | Turing | 2560 | 16 GB | 320 GB/s | 75 W | 3.0x16 |
| Quadro RTX 8000 | Turing | 4608 | 48 GB | 672 GB/s | 250 W | 3.0x16 |
| A2 | Ampere | 1280 | 16 GB | 200 GB/s | 60 W | 4.0x8 |
| RTX A4000 | Ampere | 6144 | 16 GB | 448 GB/s | 140 W | 4.0x16 |
| RTX A5000 | Ampere | 8192 | 24 GB | 768 GB/s | 230 W | 4.0x16 |
I have skipped older Nvidia generations like Pascal and Volta because Nvidia is phasing out driver support for those, and I have skipped newer generations like Ada Lovelace and Blackwell because they’re still very expensive. I’m only looking at workstation and data center cards because these tend to be smaller and use less energy compared to their desktop counterparts. I’m not using any AMD or Intel cards because those don’t have good arm64 support.
Test Setup
I’m using my Ampere homelab server with Debian 12 as a test bench. The arm64 driver installation is documented here (currently running driver version 535.216.01 with CUDA version 12.2).
For the 100% GPU load tests I’m using wilicc/gpu-burn with the command
docker run --rm -it --gpus all gpu_burn "./gpu_burn" "300"
It runs the GPU at 100% load for 5 minutes – good for checking power consumption and thermals.
For the LLM benchmarks I’m using stefanthoss/ollama-server-benchmark together with a Docker-based Ollama installation (version 0.6.5). I ran every benchmark 3 times and took the mean of the resulting values. I evaluated the following models because they fit in 16GB VRAM and perform well in my experience:
- deepseek-r1:14b
- gemma3:12b
- llama3.1:8b
- mistral-nemo:12b
I did not evaluate the quality of the output.
Power Consumption
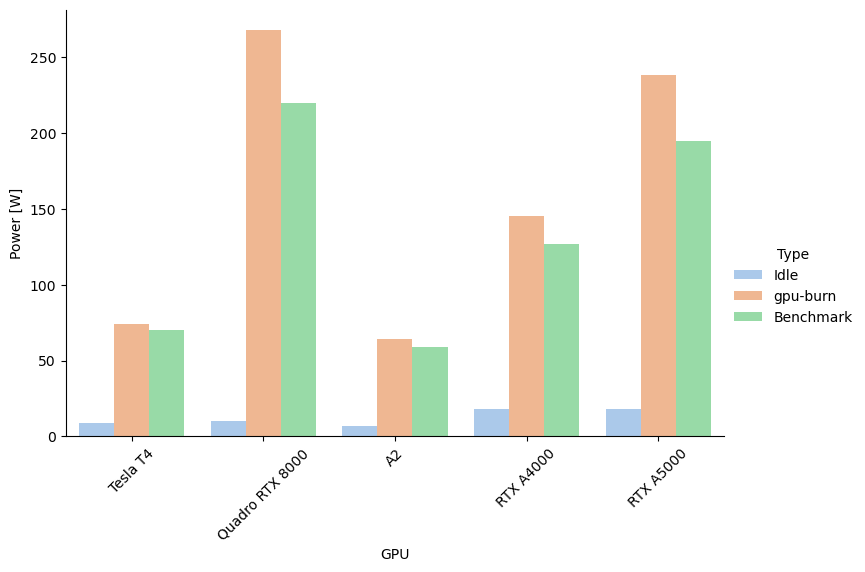
Here is the GPU’s power consumption as measured with a Kill-A-Watt at the wall outlet. For the idle case I confirmed with
nvidia-smi that the driver was loaded but no workload was running (I have observed a weird behavior where Nvidia GPUs
consume significantly more power when the OS hasn’t loaded the driver).
| GPU | Idle | gpu-burn | Benchmark |
|---|---|---|---|
| Tesla T4 | 9 W | 74 W | 70 W |
| Quadro RTX 8000 | 10 W | 268 W | 220 W |
| A2 | 7 W | 64 W | 59 W |
| RTX A4000 | 18 W | 145 W | 127 W |
| RTX A5000 | 18 W | 238 W | 195 W |
It is notable that the two Ampere-generation workstation cards have an idle power consumption that’s quite a bit higher that the other cards. It’s most surprising to me that the massive 48GB VRAM Quadro RTX 8000 only consumes 10 Watt when idle.
During gpu-burn, the power consumption is very close to the official TDP value and while running the benchmark, it’s just a bit lower than that.
LLM Performance
Here is the average token/s performance per GPU and for a CPU-only setup:
| Benchmark | Token/s |
|---|---|
| CPU | 5.2 |
| Tesla T4 | 21.9 |
| Quadro RTX 8000 | 52.5 |
| A2 | 17.3 |
| RTX A4000 | 40.4 |
| RTX A5000 | 57.1 |
And as a graph by benchmarked model:
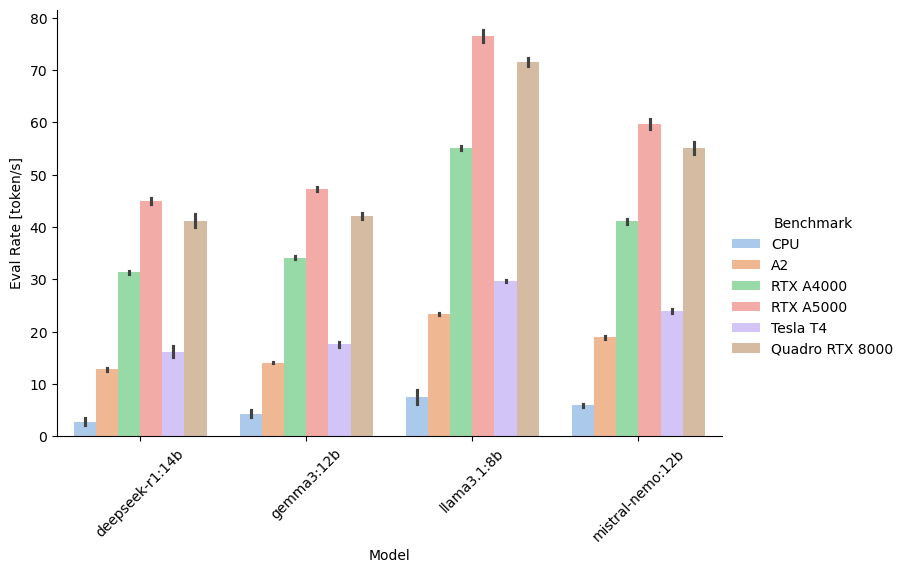
It is clear that running an LLM on the CPU results in very low performance. But I’m surprised that the A2 data center card also has such low token/s performance which could be related to the lower number of CUDA cores or lower memory bandwidth compared to the other cards. Not surprising that the RTX A5000 is the winner here as it is the newest card with the highest specs.
Across all benchmarks, the smaller 8B parameter Llama 3.1 model is the fastest. More on model size in the section on larger models below.
Load Time Analysis
I also measured the load time, i.e. the time it takes for the model to be loaded into VRAM and start hallucinating
thinking:
| Benchmark | Load time [s] |
|---|---|
| CPU | 2.5 |
| Tesla T4 | 3.9 |
| Quadro RTX 8000 | 3.5 |
| A2 | 3.8 |
| RTX A4000 | 3.4 |
| RTX A5000 | 4.0 |
And as a graph by benchmarked model:
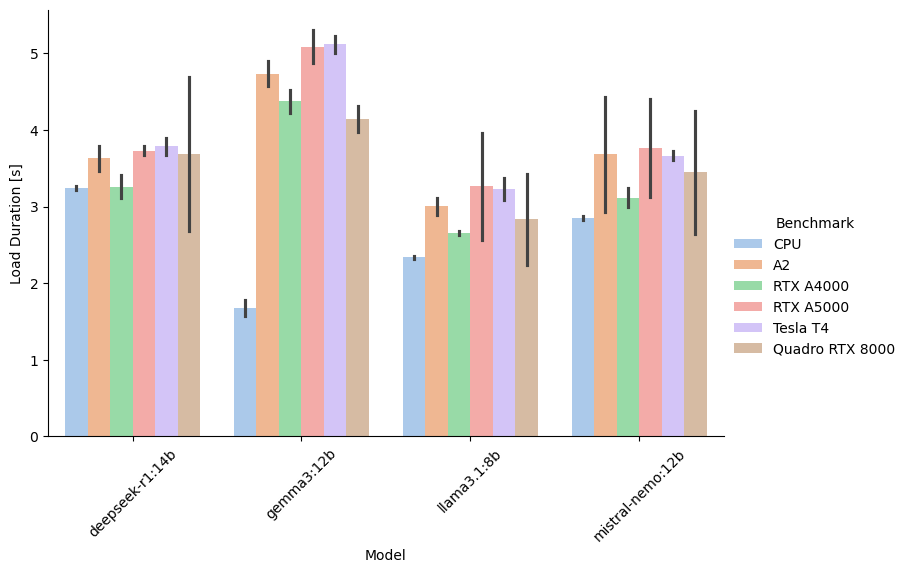
Overall the load times are almost the same for all GPUs and models. It’s notable that models load faster on the CPU and that the Gemma3 model has generally longer load times across all GPUs.
Load times are only relevant if you’re using a lot of different models and constantly unload and reload them. I recommend standardizing all your workflows on one LLM and permanently preload it with
curl http://ollama-host:11434/api/generate -d '{"model": "gemma3:12b", "keep_alive": -1}'
Using above command, Ollama loads the model and keeps it indefinitely in memory – minimizing the Time to First Token (TTFT).
Larger LLMs
I also looked at larger 24B to 70B parameter models and how they perform on the RTX A5000 and the Quadro RTX 8000:
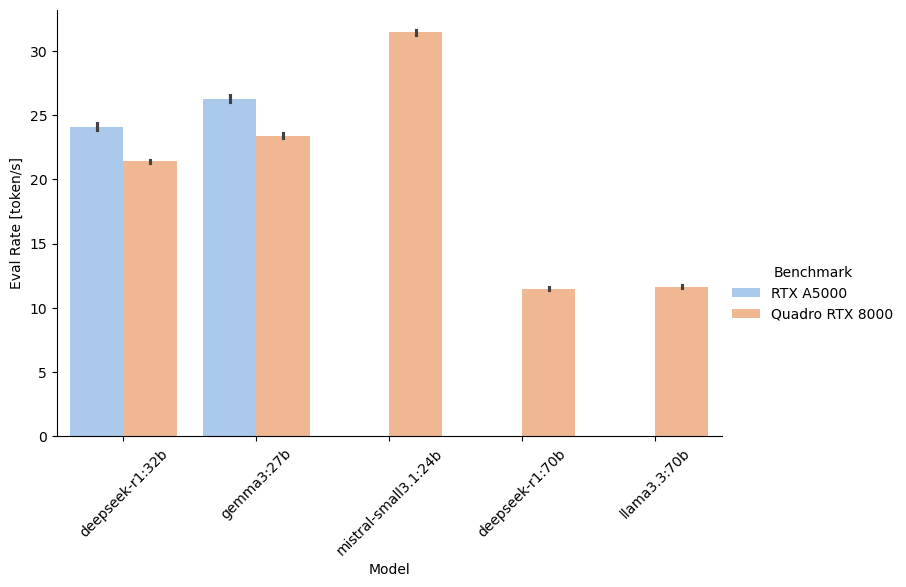
It seems that a model with twice the size has roughly half of the eval rate. The large 70B parameter models from Deepseek and Llama 3.3 only fit on the Quadro RTX 8000 and result in less than 12 token/s – compare that with 71.6 token/s for llama3.1:8b on the Quadro RTX 8000. You have to decide whether the perceived model quality increase is worth the significant reduction in eval rate.
Conclusion
Considering used market prices as of May 2025, I think the RTX A4000 for smaller models and the Quadro RTX 8000 for larger models give you the best value for the money. I was surprised that both the performance and power consumption difference between the two Nvidia generations is not that large using Ollama. This might change however with different or newer software. I would also like to compare image generation and other “AI” use cases – but that’s a topic for another blog post.