Track Heating and Cooling Hours with Home Assistant
Home Assistant doesn’t provide a built-in capability to track the amount of time that your furnace or A/C runs each day.
Tracking this can be useful to understand your heating/cooling needs and maybe reducing them. This functionality can be
added with a template sensor and history statistics. This guide assumes that you have a thermostat in Home Assistant
that is exposed as a climate entity (like most climate integrations
are).
The current thermostat state (heating/cooling/idle) is not exposed as an entity but only as an entity attribute in the thermostat. So we have to create a template sensor that exposes the state as its own entity.
Add this to your configuration.yml file if you have a thermostat called climate.living_room_thermostat:
template:
  - sensor:
      - name: "Living Room Thermostat State"
        state: "{{ state_attr('climate.living_room_thermostat', 'hvac_action') }}"
Now we can create a history stats sensor that calculates the number of hours for each day that a certain state is active.
Add this to your configuration.yml file for the template sensor above:
sensor:
  - platform: history_stats
    name: "Living Room Heating Hours Today"
    entity_id: sensor.living_room_thermostat_state
    state: "heating"
    type: time
    start: "{{ now().replace(hour=0, minute=0, second=0) }}"
    end: "{{ now() }}"
  - platform: history_stats
    name: "Living Room Cooling Hours Today"
    entity_id: sensor.living_room_thermostat_state
    state: "cooling"
    type: time
    start: "{{ now().replace(hour=0, minute=0, second=0) }}"
    end: "{{ now() }}"
Now you have two sensors (sensor.living_room_heating_hours_today for heating, sensor.living_room_cooling_hours_today
for cooling) that track the heating/cooling duration of your thermostat in hours. If your thermostat provides only
heating or only cooling, just omit the other sensor.
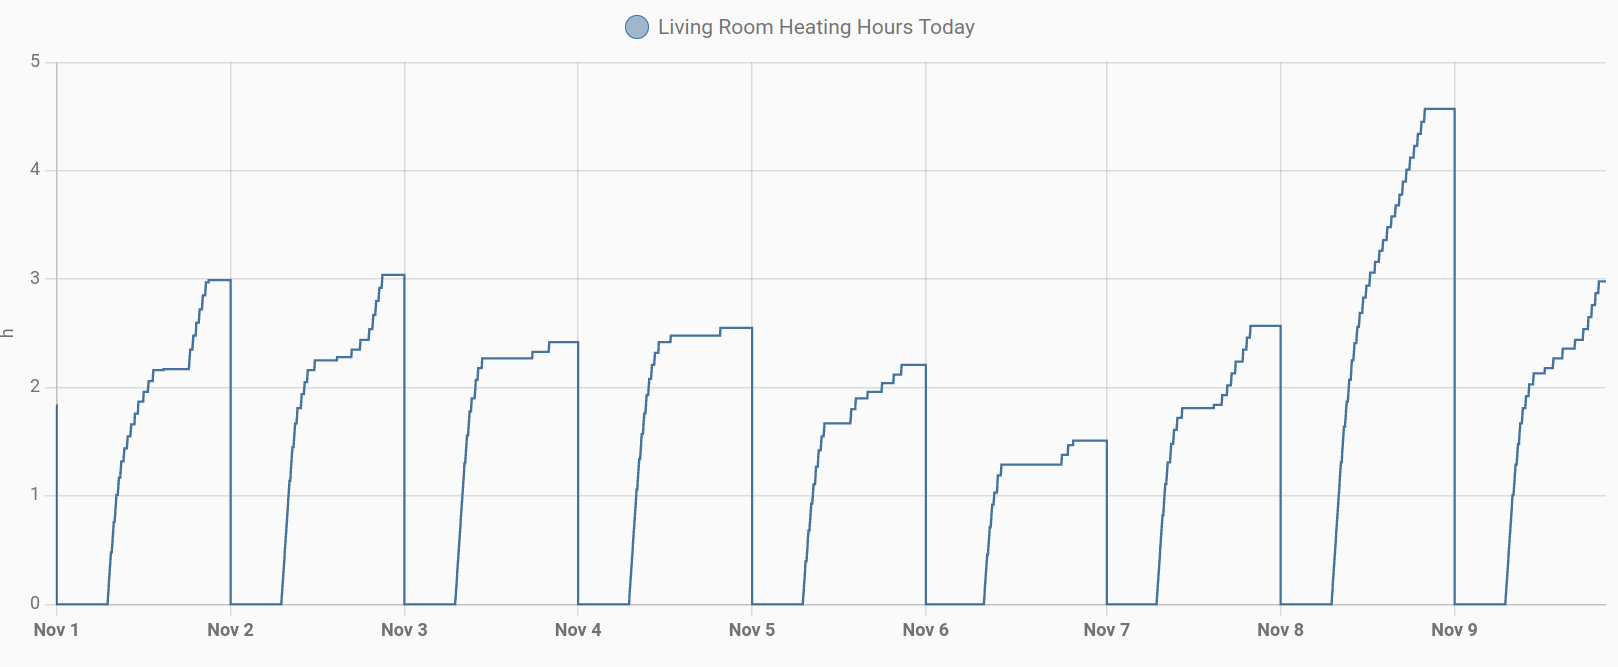
When looking at the sensor’s history, you’ll see that its value increases while the heater runs and resets at midnight. The value at midnight represents the number of hours that heating was used that day.

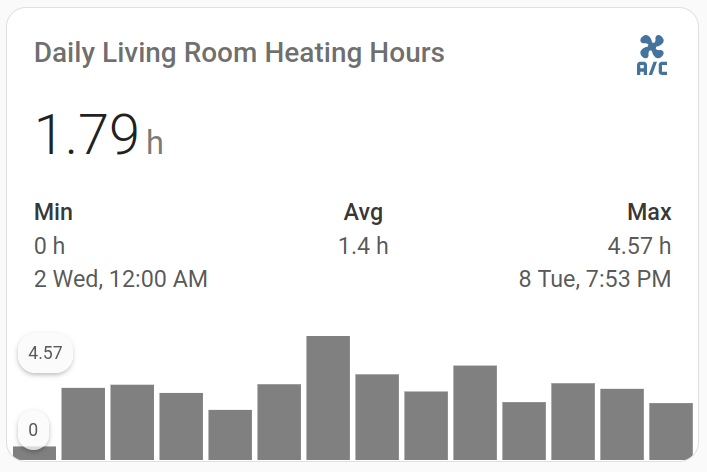
I prefer to present this data using the Lovelace Mini Graph Card (can be installed through HACS). This graph card is one of my favorite ways to show data in Home Assistant and it can plot a nice bar diagram of the daily heating (or cooling) hours over the last 2 weeks:
type: custom:mini-graph-card
name: Daily Living Room Heating Hours
icon: mdi:air-conditioner
entities:
  - entity: sensor.living_room_heating_hours_today
    name: Living Room
    show_state: true
    color: gray
hours_to_show: 336
lower_bound: 0
group_by: date
aggregate_func: max
show:
  labels: true
  graph: bar
  average: true
  extrema: true
