Monitor the Health of Multiple SMART Disks with Scrutiny
Scrutiny is a tool that collects SMART hard drive data and exposes them through a web UI (read more about SMART on Wikipedia). You can run a central Docker container that contains the database and web UI. Data collection agents on multiple clients will collect the data and send it to the central instance. This will provide a single interface to monitor all hard drives in all servers. I’m using it to monitor my TrueNAS disks and the NVMe drives in my Debian servers.
Web UI
The web UI can be deployed using the analogj/scrutiny:web Docker image (the analogj/scrutiny:latest image contains
both the web UI and the data collector, but I want to deploy them separately). I use docker-compose files to deploy the
application. Create a new directory and the following Dockerfile:
version: "3"

services:
  scrutiny:
    image: analogj/scrutiny:web
    container_name: scrutiny-web
    restart: unless-stopped
    ports:
      - "8080:8080"
    healthcheck:
      test: "curl -f -s http://localhost:8080/web/dashboard"
    volumes:
      - ./config:/scrutiny/config
    environment:
      - GIN_MODE=release
Or download the file from my collection of docker-compose files and start it:
mkdir scrutiny
cd scrutiny
wget https://raw.githubusercontent.com/stefanthoss/container-fest/main/scrutiny/docker-compose.yml
docker-compose up -d
The web UI will be available at port 8080 of the Docker host. Here’s a screenshot of the web UI with 4 disks from 2 servers:
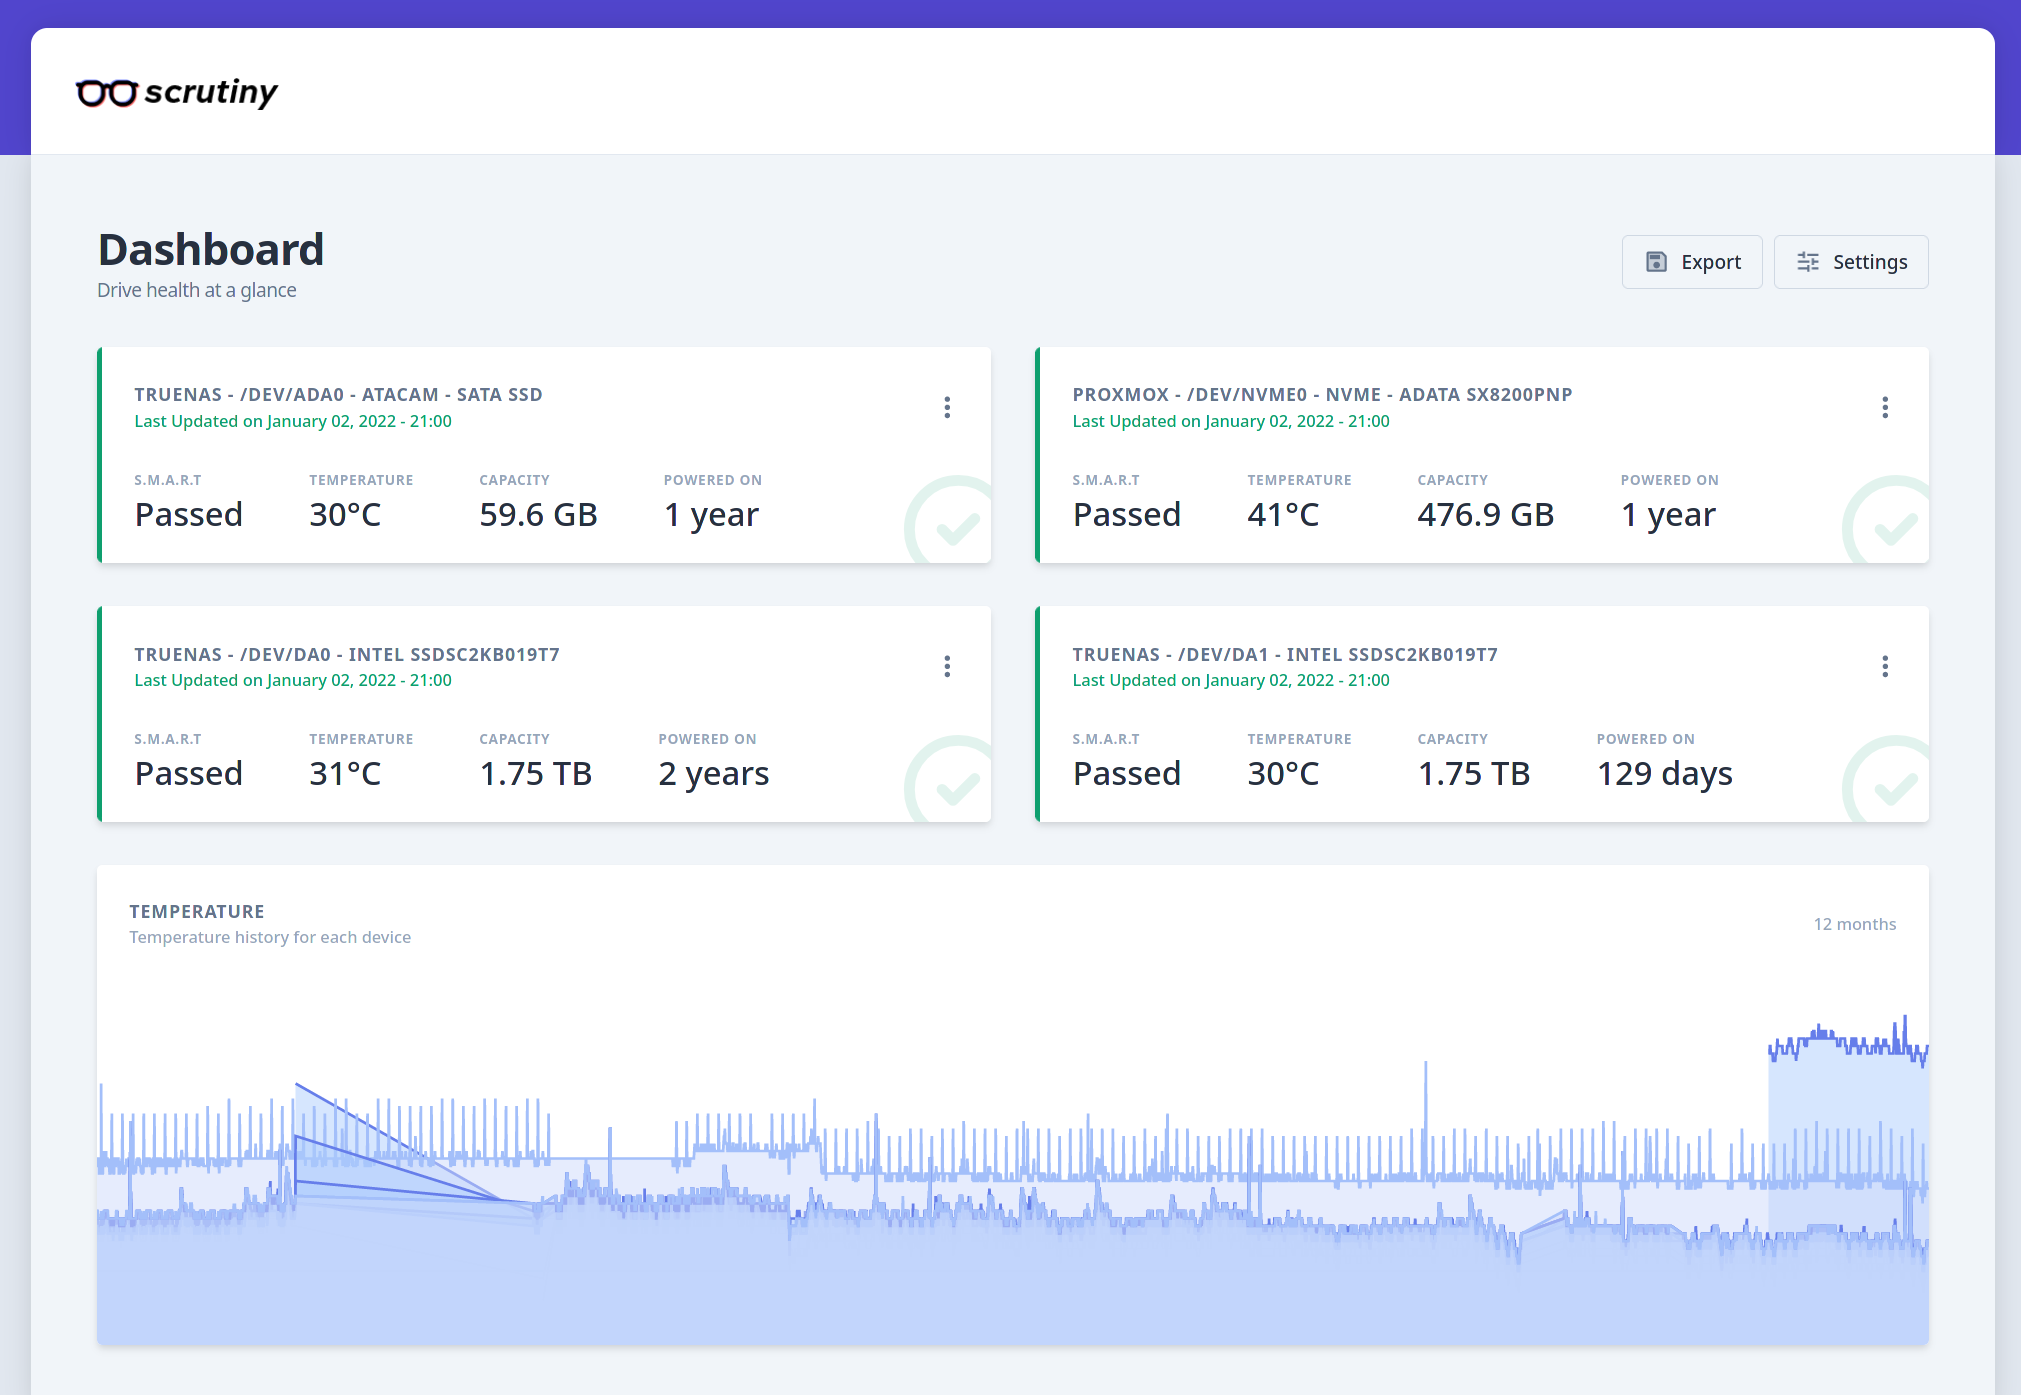
Now you have to install the data collector on the servers that contain the disks you want to monitor. Below are instructions for TrueNAS and Debian.
Data Collector on TrueNAS
Scrutiny needs Smartmontools version 7. Check on the TrueNAS terminal that version 7 is installed. TrueNAS Core 12.0
ships with Smartmontools 7.2 as checked with the smartctl -V command:
smartctl 7.2 2020-12-30 r5155 [FreeBSD 12.2-RELEASE-p6 amd64] (local build)
Download the Collector agent binary (below link is for version 0.3.13 - the latest as of January 2022). Then copy it to
/usr/local and make it executable. In short, execute the following as root:
mkdir -p /usr/local/tools/scrutiny/bin
wget https://github.com/AnalogJ/scrutiny/releases/download/0.3.13/scrutiny-collector-metrics-freebsd-amd64 -P /usr/local/tools/scrutiny/bin
chmod +x /usr/local/tools/scrutiny/bin/scrutiny-collector-metrics-freebsd-amd64
Create the configuration file by downloading the sample collector.yaml from the GitHub repo. Edit it and change the
following parameters:
host.idshould be an identifier for your TrueNAS serverapi.endpointshould be the HTTP endpoint of the Scrutiny Web server that we deployed using Docker (e.g.http://192.168.1.5:8080)
Everything else can be left as is. Here are the commands which have to be executed as root:
mkdir -p /usr/local/tools/scrutiny/config
wget https://raw.githubusercontent.com/AnalogJ/scrutiny/master/example.collector.yaml -O /usr/local/tools/scrutiny/config/collector.yaml
nano /usr/local/tools/scrutiny/config/collector.yaml
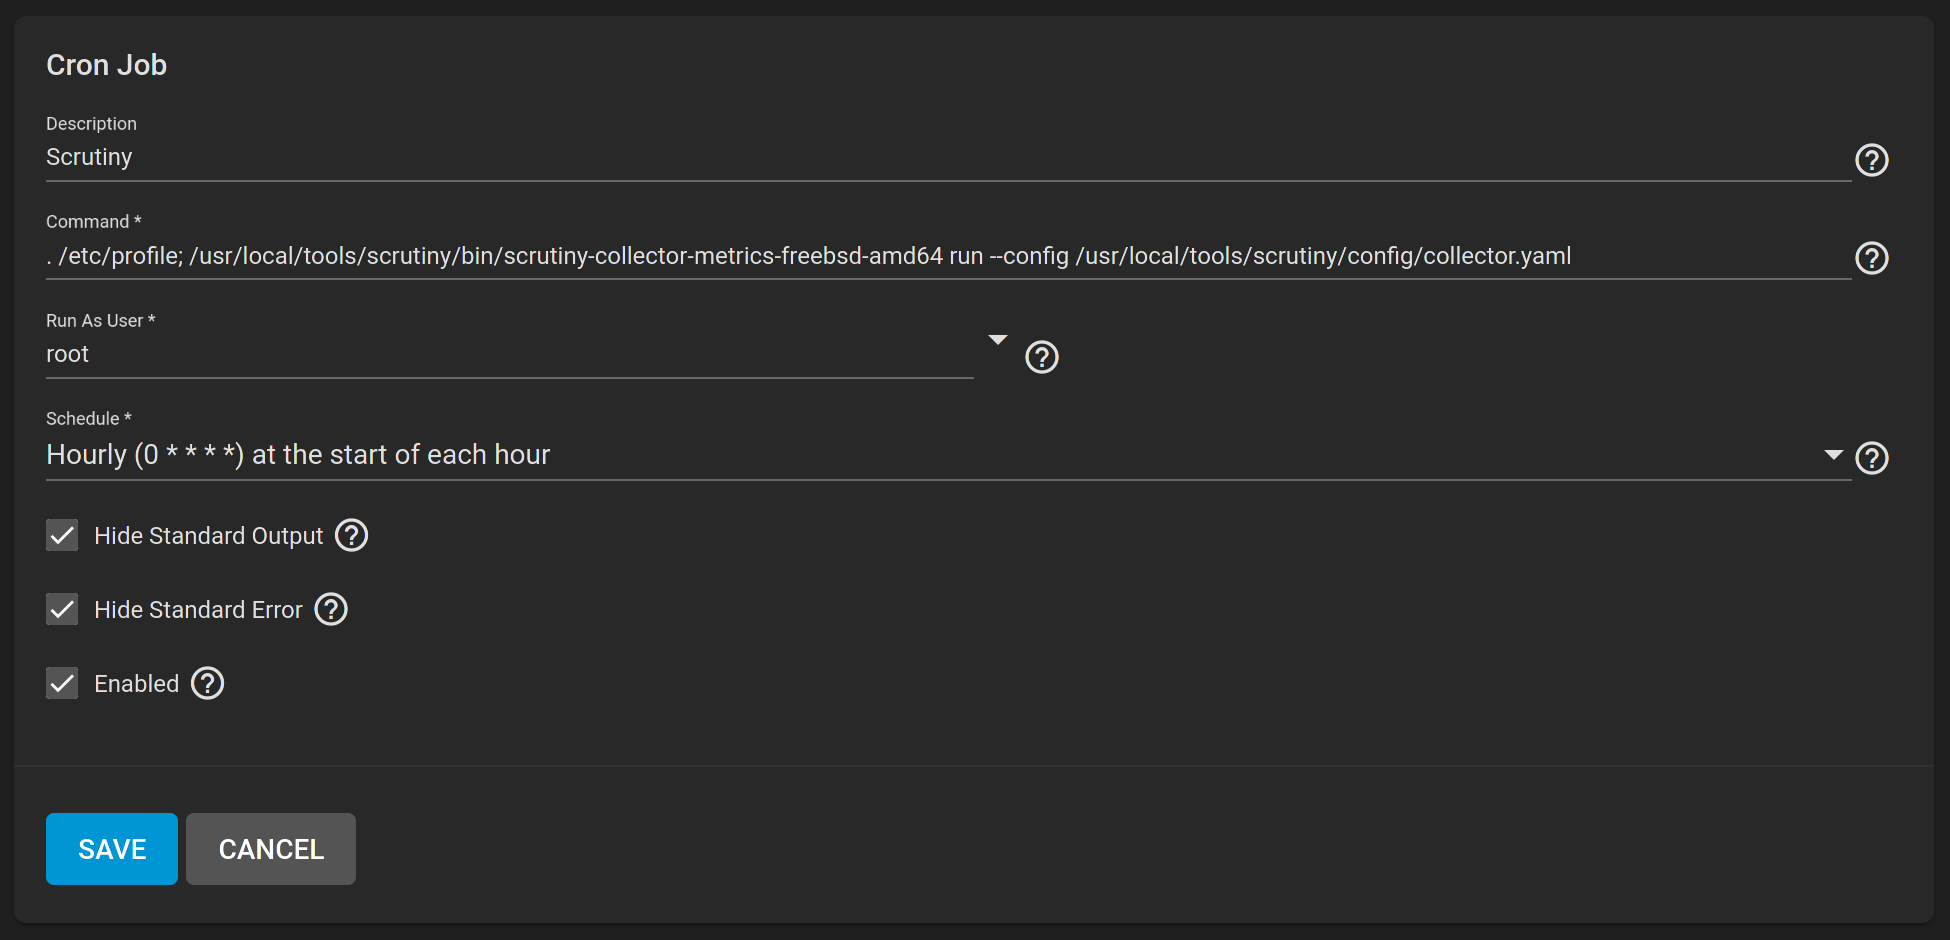
Now go to Tasks → Cron Jobs and add a new cron job:
| Description | Scrutiny |
| Command | . /etc/profile; /usr/local/tools/scrutiny/bin/scrutiny-collector-metrics-freebsd-amd64 run --config /usr/local/tools/scrutiny/config/collector.yaml |
| Run As User | root |
| Schedule | Hourly |
Enable both Hide Standard Output and Hide Standard Error once you confirmed the data collector to be working.
Otherwise, TrueNAS will send an email with the full log for every single log.
At the start of the next hour, the SMART data should appear in the Scrutiny Web UI.
Data Collector on Debian
Follow the Scrutiny installation instructions to install the collector agent. You don’t have to install the web UI / API.
Edit the /opt/scrutiny/config/collector.yaml file and change the following parameters:
host.idshould be an identifier for your Debian server, e.g. the hostnameapi.endpointshould be the HTTP endpoint of the Scrutiny Web server that we deployed using Docker (e.g.http://192.168.1.5:8080)
Using crontab -e you can schedule the data collector to run as an hourly job:
0 * * * * . /etc/profile; /opt/scrutiny/bin/scrutiny-collector-metrics-linux-amd64 run --config /opt/scrutiny/config/collector.yaml
At the start of the next hour, the SMART data should appear in the Scrutiny Web UI.